RailMadad Analytics
Enhancing Customer Experience through Data
RailMadad Analytics enhances Indian Railways with data-driven insights to boost passenger satisfaction, streamline operations, and improve service quality.
Benefits of RailMadad
RailMadad Analytics is a digital platform transforming how Indian Railways gathers and utilizes passenger feedback. It integrates data from multiple sources to provide deep insights into service quality, enabling informed decision-making for enhancing passenger satisfaction.
Objective
RailMadad Analytics project is to leverage advanced data collection, analysis, and visualization tools to enhance service quality and customer satisfaction across the Indian Railways network through informed decision-making and continuous improvement initiatives.
Advantages
- Comprehensive Feedback Integration: Centralizes feedback from multiple sources (online forms, mobile apps, paper surveys) into a single platform, ensuring all data is easily accessible and manageable.
- Advanced Data Analysis: Utilizes smart analytics to convert complex feedback data into clear insights, enabling railway authorities to identify trends, patterns, and areas needing improvement efficiently.
- Enhanced Decision-Making: Provides actionable information and performance metrics that empower railway managers to make informed decisions on resource allocation and service improvements..
- User-Friendly Interface: Offers intuitive data visualization tools such as charts and graphs, making it accessible for non-technical users to interpret and act upon feedback data effectively.
- Scalability and Continual Improvement: Designed to scale across the entire Indian Railways network, with provisions for regular updates and enhancements based on ongoing feedback and evolving requirements.
App Interface and Features
Unified Data Collection
- Gathering Feedback:Collect feedback from passengers through various channels, like online forms, mobile apps, and even paper surveys.
- One-Stop Data Hub: Store all this feedback in one central place, making it easy for you to view and manage.
Analytical Engine
- Smart Analysis: Use advanced technology to analyze the feedback data.
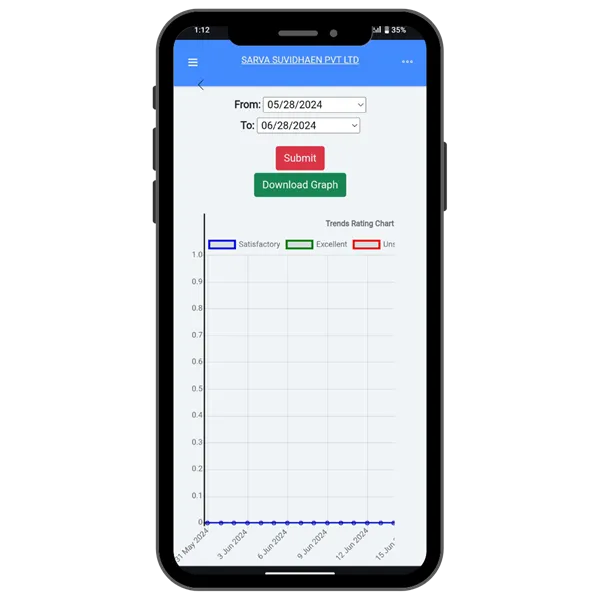
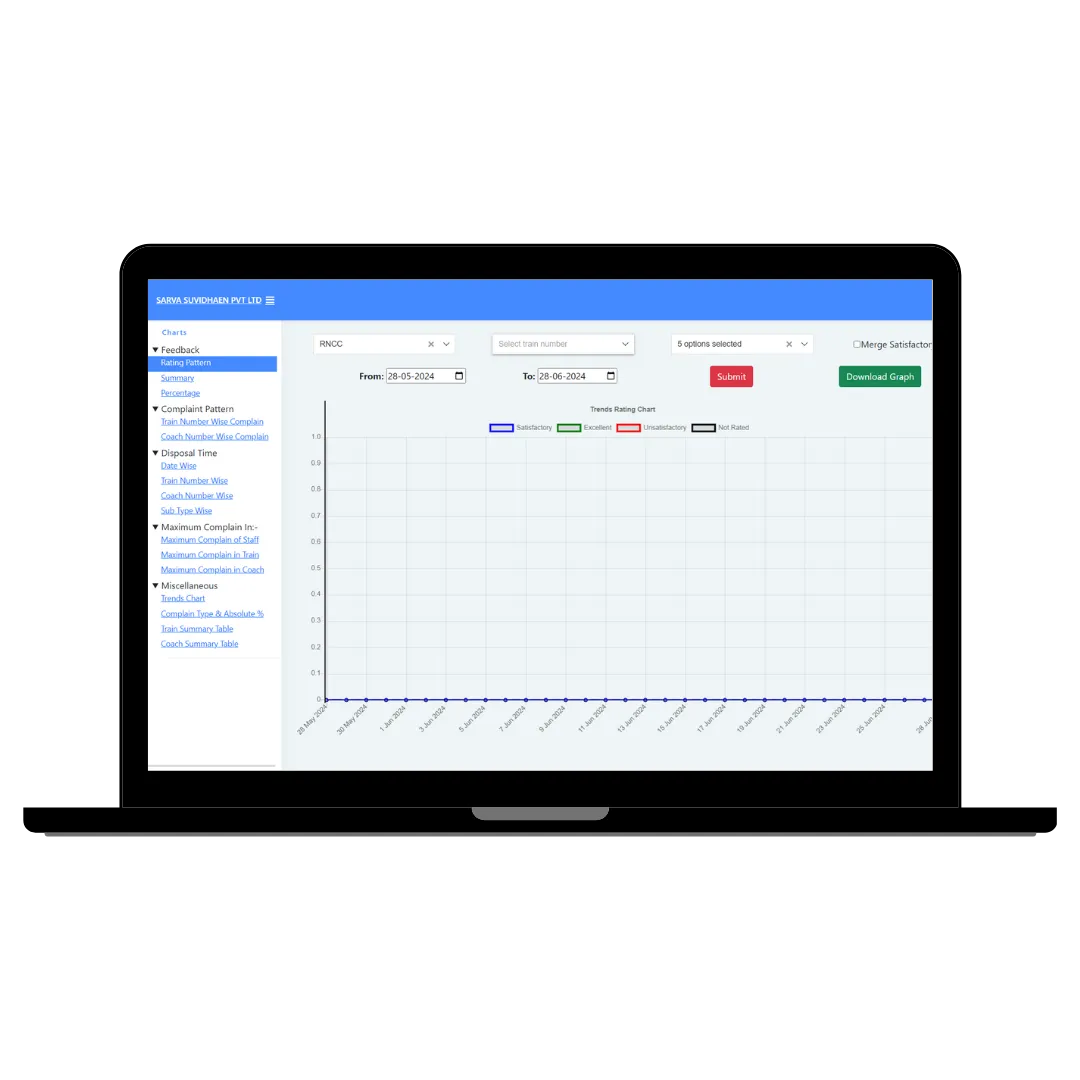
- Easy-to-Understand Reports:Convert complex data into simple charts and graphs that highlight important trends and patterns.
Feedback Analysis
- Detailed Breakdown: Analyze the feedback to show patterns over time, like how many complaints were received each month.
- Visual Representation: See feedback as easy-to-read charts, like pie charts and bar graphs, showing different types of complaints and their frequency.
Service Quality Tracking
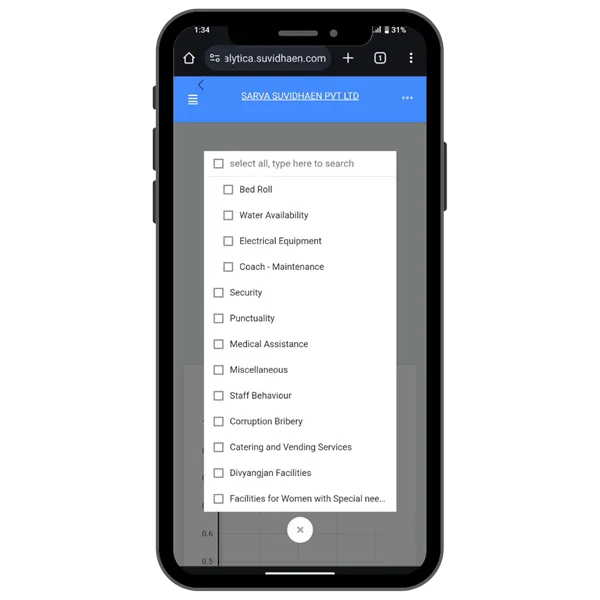
- Multiple Dimensions:Track various aspects of service, such as cleanliness, punctuality, and staff behavior.
- Performance Overview: Get a clear picture of how well each service area is performing.
User Management
- Add and Manage Users: Admins can add new users and control what they can see and do.
- Secure Access: Ensure that only authorized personnel can access sensitive information.
Data Visualization
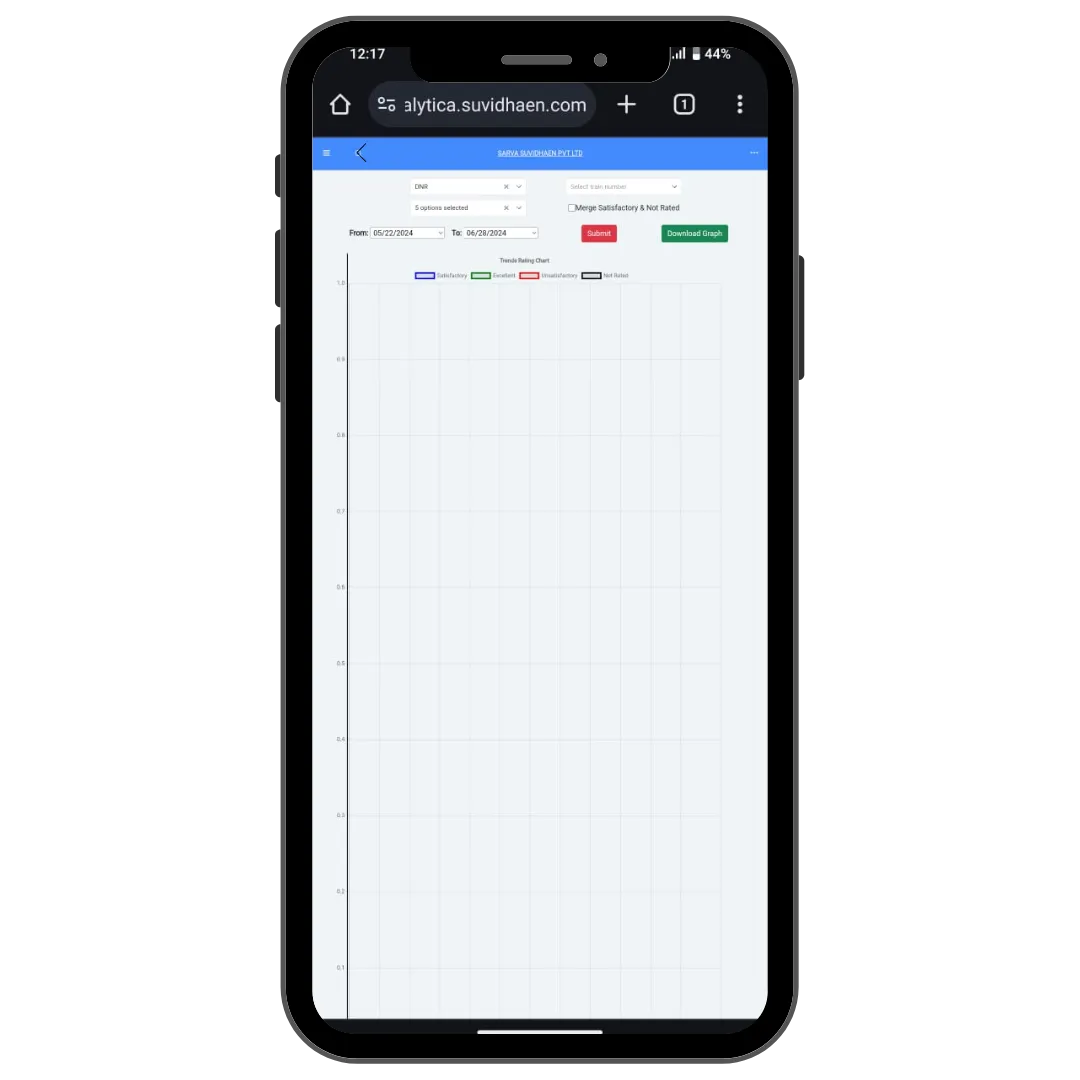
- Visual Tools:Turn data into visual formats like graphs and charts.
- Downloadable Content: Easily download visuals for presentations or reports.
How to Use
Data Collection and Upload
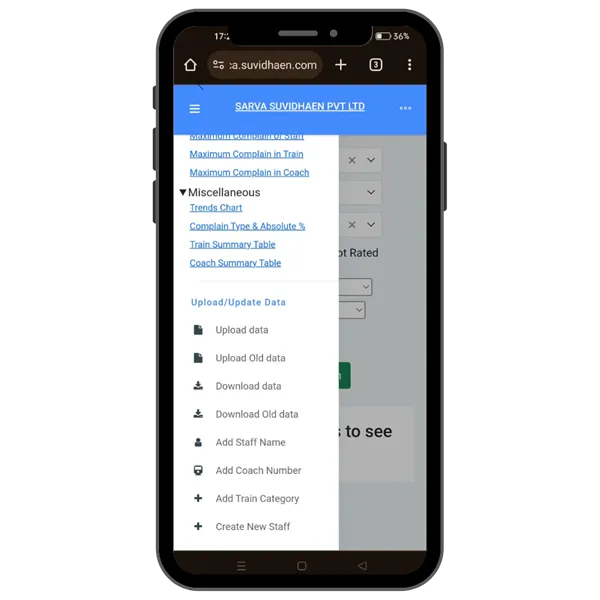
- Download Data: Regularly download passenger feedback data from the ad system. Ensures the system always has the latest information for analysis.
- Upload Data: Upload this data to the RailMadad Analytics system to kep-to-date. Ensures the system always has the latest information for analysis.
Data Analysis and Visualization.
- Analyze Data: Use the analytical engine to process and analyze the uploaded d Helps quickly identify problem areas and understand overall service performance.
- View Visuals: Check the charts and graphs to understand feedback tre Helps quickly identify problem areas and understand overall service performance.
User Onboarding and Management
- Add Users: Admins can add new users who need access to tem. Ensures the right people have access and can use the system effectively.
- Set Permissions: Define what each user can see and do based on ole. Ensures the right people have access and can use the system effectively.
Feedback Analysis
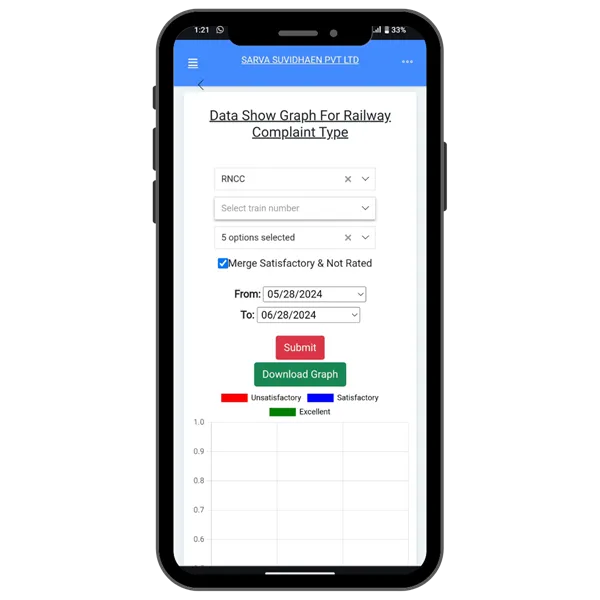
- Select Filters: Choose filters like train number, coach number, and date range to narrow down the feedback. akes it easy to focus on specific areas of interest and understand passenger feedback in detail.
- View Analysis: Look at the interactive charts and graphs that show feedback patterns. akes it easy to focus on specific areas of interest and understand passenger feedback in detail.
Performance Tracking
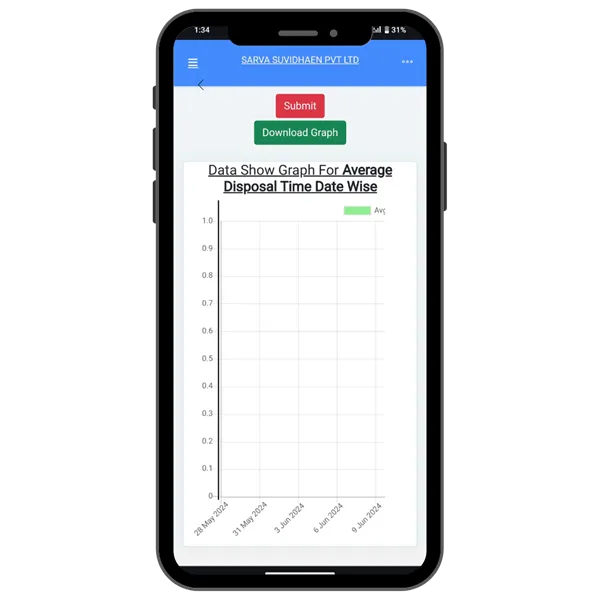
- Monitor Complaints: Track how quickly and effectively complaints are being resolved. Helps in improving the response to passenger complaints and enhancing overall service quality.
- Identify Trends: Look for patterns in the data to identify staff or services that are performing well or poorly. Helps in improving the response to passenger complaints and enhancing overall service quality.
Report Generation
- Generate Reports: Use the system to create detailed reports on various metri Provides comprehensive documentation of service performance and areas for improvement.
- Download Reports: Download these reports for offline analysis or sharing with othe Provides comprehensive documentation of service performance and areas for improvement.
